Enrollment strategy
When enrollment drops, everyone has a theory
The numbers on your online course or certification program have started to dip, and before you’ve even had time to pull the numbers together, everyone has a theory about how to increase course enrollment.
You need more leads.
The new sales page isn’t working.
Your SEO traffic isn’t good enough.
People can’t afford the program anymore.
The admissions team isn’t following up quickly enough.
The market is simply harder this year.
Maybe.
Any one of those things could turn out to be behind your low course enrollment, but right now they’re stories.
And this is where education businesses can waste an extraordinary amount of time and money.
A plausible explanation gets repeated in a couple of meetings and quietly turns into a fact.
Nobody actually established that the sales page was the problem, but three weeks later you’re rewriting it.
Nobody knows whether price is stopping people from enrolling, but someone has already started modelling a discount.
Nobody checked whether you genuinely have a traffic problem, but the conversation has moved on to increasing the advertising budget.
Somewhere along the way, you’ve gone from “course sales declining” to “this is why sales are down” without doing the important bit in between.
If you’re searching for practical guidance on how to increase course enrollment, the most important thing to understand first is this: the answer is almost never where you think it is.
This article will show you how to find out where it actually is.
Key takeaways in this article
-
Low course enrollment doesn’t automatically tell you what the problem is. Before changing your sales page, pricing, traffic strategy or admissions process, look at where the numbers actually changed.
-
The biggest drop isn’t always the thing that got worse. A stage can lose lots of people and still be performing exactly as it always has.
-
Compare like with like. Use a sensible previous cohort or enrollment period so you can see what is genuinely different this time.
-
Your numbers can tell you where to investigate, not always why something happened. Once you know where the change sits, then look at what changed around that part of the journey.
-
Sometimes the most valuable conclusion is what not to fix. If a part of the journey is stable, don’t make it the first place you spend time and money.
-
You don’t need perfect data to learn something useful. Even a partial view can help you narrow the problem without pretending you know more than you do.
Enrollment down? We want an explanation
This is completely understandable.
If your online course enrollment normally sits at 120 students and this intake brings in 87, you’ll want to look at those missing 33 students and address them.
You want to understand what happened, especially when those 33 students represent a significant amount of revenue.
The problem is that we tend to reach for the explanation that is most visible, most recent or most familiar.
You redesigned the program page, hired a new admissions person, changed your pricing, moved to a different marketing agency or started getting more traffic from Google. Suddenly there’s a wonderfully neat story connecting the change to the result.
We changed X. Enrollment dropped. X must be the problem.
Except this is not how to diagnose low enrollment in your online course or certification program.
There are usually several steps between someone first discovering your program and becoming a student. Unless you look at what happened across those steps, you don’t actually know where things changed.
And if you don’t know where things changed, deciding what to fix is mostly guesswork.
Start with “Where did the numbers change?”
Before asking how to increase course enrollment, start with a simpler question: where did the numbers change?
Take your latest enrollment period and compare it with a sensible previous one. For a cohort-based program, that might mean comparing this spring intake with last spring’s. If your program enrolls continuously, it might mean January to June this year compared with January to June last year.
Then map the major steps people take on their way to becoming students. It doesn’t need to be complicated. For many education businesses, it might look roughly like this:
Find the program → show interest → apply → go through admissions → make a payment → enroll
Your online course enrollment journey might include a syllabus download, webinar, information session or discovery call. That’s fine. What matters is that you can see roughly how many people reached each important point during both periods.
Now you have something much more useful to work with. Instead of asking the entire business, “Why is enrollment down?”, you can start asking where the difference actually appeared.
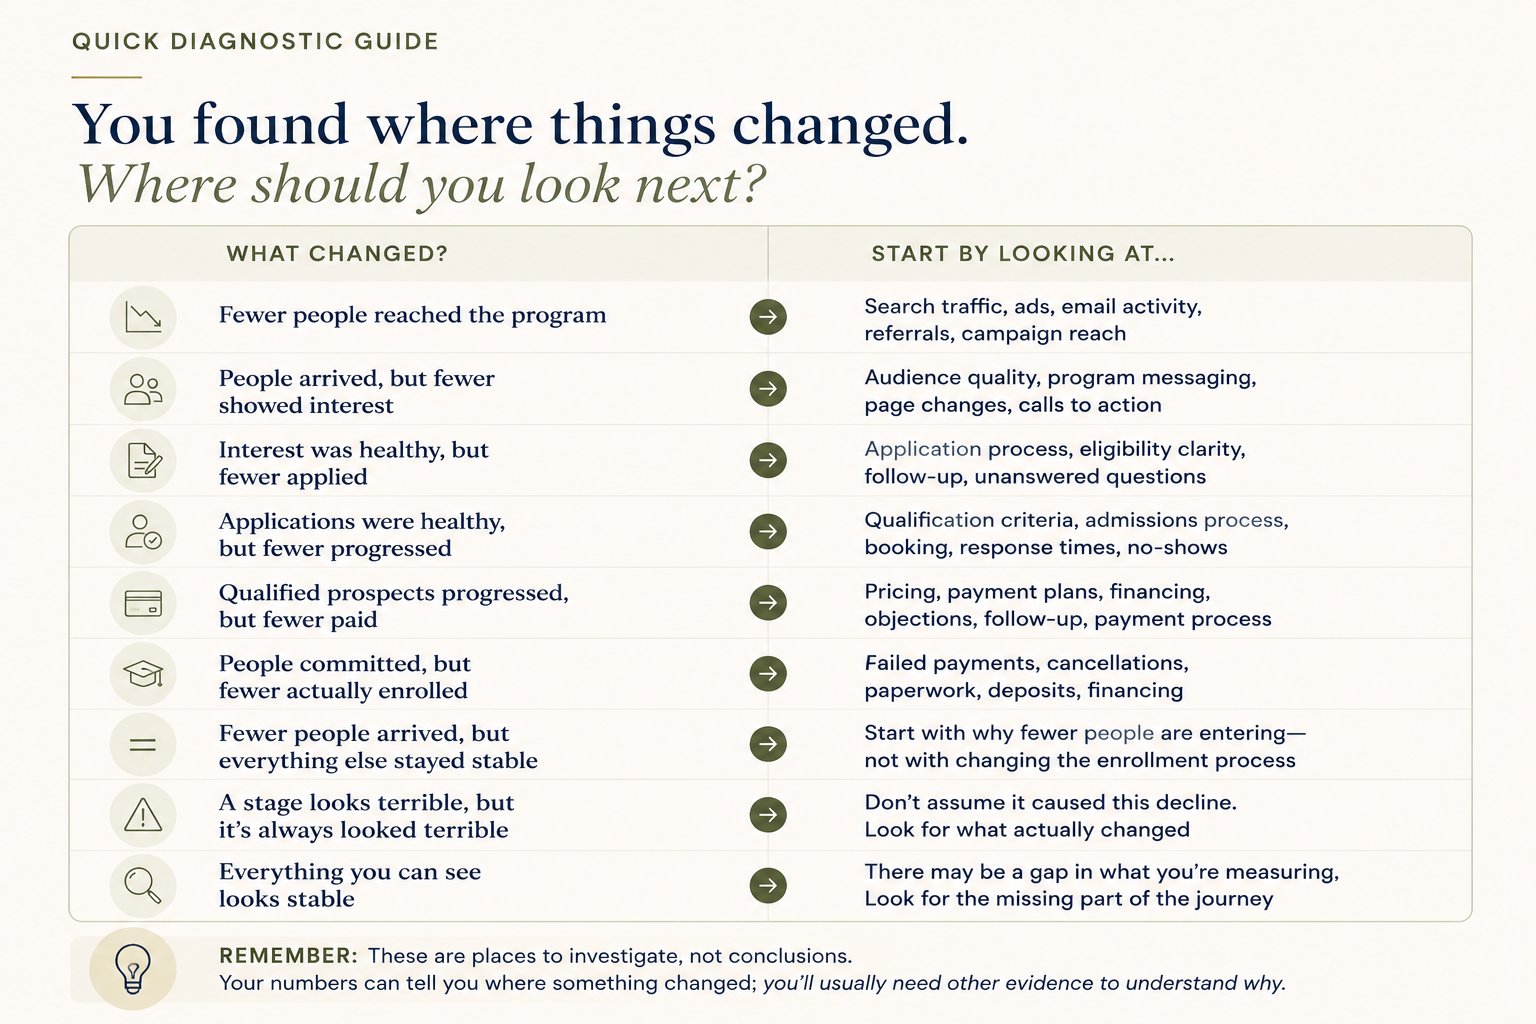
Are fewer people finding the program?
Imagine your program page received 20,000 visits during the previous enrollment period and 14,000 this time around. Once people arrived, however, they behaved much as they did before: a similar proportion showed interest, applied and eventually enrolled.
That tells you something important before you’ve investigated a single marketing campaign. You have roughly 30% fewer people entering the enrollment journey in the first place.
It doesn’t automatically mean your SEO is broken. Paid advertising might have been reduced, a referral partner might have disappeared, search demand could have changed, or your campaign may simply have run for less time. You might even discover a tracking problem.
Those are the next questions to investigate. What the numbers don’t give you a good reason to do is immediately rewrite your application or overhaul admissions. If the clearest difference is that fewer people arrived in the first place, start by understanding why.
Are people finding you but showing less interest?
Now imagine the number of people visiting the program page is almost identical. Last year you had 20,000 visitors, and this year you had 20,500, but the number requesting information about the program has fallen from 4,000 to 2,800.
That’s a very different situation. You don’t appear to have an obvious problem getting people to the program but rather a “traffic but no course sales” issue.
Something has changed between people arriving and deciding that they want to know more.
Now your program page, message, offer and the kind of traffic you’re attracting become sensible things to investigate. Perhaps the page changed. Perhaps the audience changed. Perhaps the way you’re asking people to take the next step changed.
Notice the distinction, though: they’ve become things worth investigating, not things we’ve already decided are responsible.
That distinction may sound small, but it can save you from spending the next month fixing the wrong thing.
Are people interested but fewer are applying?
Perhaps traffic is steady, and plenty of people are still requesting the syllabus, attending your webinar or joining an information session. People are showing clear interest, but applications have fallen sharply.
Now you can move the investigation further along. What happens between someone thinking “this looks interesting” and deciding “I’m willing to apply”?
Maybe the application changed, or eligibility requirements became stricter. Perhaps this is the point where people discover the price, or there’s a long delay between showing interest and being invited to apply. Maybe the follow-up process changed.
Again, we don’t know yet. But we’ve moved from a vague question: why are course sales down?, to a much better question: why are interested prospects less likely to apply than they were before?
That is a question you can actually investigate.
What if applications are healthy but enrollment is down?
This is where the instinct to “get more leads” can become particularly expensive, because what you’re seeing is leads but no enrollments.
Suppose you received 1,000 applications during the previous period and 1,050 this time around, yet enrollment fell from 400 students to 290.
You can certainly go and generate another thousand website visitors, but it doesn’t answer the much more obvious question: what happened to the people who were already interested enough to apply?
Now you need to look further along the enrollment journey. Are fewer applicants being accepted? Are accepted applicants failing to take the next step? Are fewer moving forward after speaking with admissions? Are people getting as far as payment and then disappearing? Are more students cancelling before they actually start?
Those are very different problems with very different possible causes. Treating all of them as “we need more leads” is a good way to spend more on marketing without understanding why the leads you already have aren’t becoming students.
The place where you lose the most people isn’t necessarily the problem
There’s another trap that catches people when they first look at their enrollment numbers: finding the biggest drop and assuming they’ve found the problem.
Imagine you discover that 80% of people who initially show interest in the program never apply. That sounds terrible. Surely that must be where your enrollment is leaking?
Not necessarily.
What if 80% didn’t apply last year either? And the year before that was roughly the same? Meanwhile, the proportion of accepted applicants who actually went on to enroll has fallen sharply this year.
It’s not to say that we shouldn’t investigate why there’s such a big drop in your certification program enrollment.
That 80% may still represent an opportunity to improve something in the future. But if you’re trying to understand why this enrollment period performed worse than the last one, a number that has barely changed is unlikely to be the explanation.
This is why looking at one enrollment period on its own can send you in the wrong direction. The biggest drop isn’t always the most useful thing to look at. Sometimes the much smaller-looking change is the one that is actually new, and can explain the dip in your certification program sales.
Sometimes the numbers tell you what not to blame
This may be one of the most valuable outcomes of doing this properly.
Imagine you recently redesigned your online program page and then enrollment fell. Unsurprisingly, the new page becomes Suspect Number One.
The team doesn’t like the new headline, someone thinks the testimonials are weaker, and before long a redesign of the redesign is underway.
Then you look at the numbers. Roughly the same number of people visited the page, a similar proportion requested more information, and a similar proportion went on to apply. The noticeable change happened much later, after applicants had already been accepted.
Could the page still be improved? Of course. Almost any page can.
But do the numbers currently give you a good reason to spend the next six weeks rebuilding it as your response to the enrollment decline? No.
Knowing what not to fix can be just as commercially valuable as knowing where to look next.
Your numbers can show you where to look. They can't always tell you why.
This is the distinction I wish more education businesses made.
Suppose you discover that far fewer accepted applicants are going on to enroll. That is genuinely useful information because you’ve narrowed the part of the journey where something appears to have changed.
What your spreadsheet cannot tell you is why.
It cannot tell you that your new payment plan is unattractive, that your admissions team isn’t creating enough trust or that students suddenly think the program is too expensive. Those are explanations, and they need evidence of their own.
This is where you bring in the other information you have. Look at what changed during the period. Talk to applicants. Review admissions notes and email replies. Check response times and payment failures. Look at the questions people were asking and the reasons they gave for not continuing.
The numbers have already done something valuable: they’ve stopped you investigating everything at once.
Be careful with “we changed X”
This deserves particular attention because it’s such an easy story to create.
Imagine enrollment falls during a period in which you also changed your price, redesigned the program page, hired a new admissions lead, introduced a new payment plan, changed your email sequence and increased your organic traffic.
All of that is useful context, but six things changing does not give you six explanations for lower enrollment.
If people are still finding the program and showing interest at roughly the same rate, I’d be less interested in blaming the page first. If applications remain strong but fewer accepted students go on to pay, then pricing, payment and what happens after acceptance become more interesting areas to investigate.
If every step looks remarkably similar to the previous period but 30% fewer people found the program in the first place, I’d look much further upstream.
The better question is not simply “What changed in the business?” It’s “What changed around the part of the enrollment journey where the numbers changed?”
What if you don't have all of this data?
You probably don’t. Most education businesses aren’t sitting on a perfectly organised dataset that follows every prospective student from first website visit to first day of class.
That doesn’t make the exercise useless.
Perhaps all you can reliably find is program-page traffic, enquiries, applications and final enrollments.
If visits, enquiries and applications are steady but enrollment is down 25%, you’ve still learned something important: the change appears to be happening somewhere after application.
You may not yet know whether it’s happening around eligibility, admissions, payment or something else. That’s okay. You’ve narrowed the question without pretending you know more than you do.
Your next step might not be to “fix the enrollment funnel” at all. It might be to find the missing information that tells you what happened between those two points.
There is nothing wrong with reaching the conclusion “we don’t know yet.” That’s a much safer business decision than confidently fixing something your evidence never pointed to in the first place.
Before you try to increase enrollment, make sure you're solving the right problem
There is no shortage of advice about how to increase course enrollment. Run ads, improve SEO, add testimonials, rewrite the sales page, send more emails, offer payment plans, run a webinar, improve follow-up.
Any one of those things might help. The question is whether it will help your particular enrollment problem.
If fewer people are finding you, improving visibility may matter enormously.
If plenty of people are finding you but they aren’t showing much interest, adding more traffic may simply give you more uninterested visitors.
If people are interested and applying but disappearing later, another SEO campaign doesn’t solve that problem either.
And sometimes, when you compare the numbers properly, you may discover that the thing everyone was preparing to fix hasn’t actually changed at all.
That’s why I’d resist starting an enrollment conversation with “What should we do to increase enrollment?”
First ask what happened.
So what do you do next?
Take your latest enrollment period and compare it with a genuinely similar previous one.
Write down the number of people at each major point you can reliably measure: how many found the program, showed interest, applied, moved through admissions, committed or paid, and ultimately enrolled.
Then look for the change. Did fewer people arrive in the first place? Did roughly the same number arrive but fewer take the next step? Where did things stay surprisingly similar? And where do you simply not have enough information yet?
Only then bring the theories back into the room.
Maybe it is the sales page. Maybe price is creating a problem. Maybe the new admissions process is losing people. Maybe SEO is attracting the wrong audience.
But now you’re no longer starting with “we think this is the problem of why course sales are down.”
You’re starting with “this is where something changed. Now let’s find out why.”
That is a much better place from which to decide what you do next.
Summary
When course sales are down, the temptation is to jump straight to an explanation: the program page, pricing, traffic, admissions, the market.
But a plausible explanation isn’t the same as evidence.
Start by comparing your latest enrollment period with a genuinely similar one and look at what actually changed.
Did fewer people find the program? Did interest fall? Did applications hold steady while fewer people ultimately enrolled? Just as importantly, which parts of the journey didn’t change?
The numbers won’t always tell you why something happened, but they can tell you where to start looking.
And sometimes, they’ll save you from spending time and money fixing something that wasn’t responsible for the decline in the first place.
Want help working out where things changed?
That’s exactly what Enrollment Pulse is designed to do.
Add the numbers you have from two comparable enrollment periods, and it will help you see where things changed, what appears to have stayed stable, and where the numbers suggest you should investigate next.
You don’t need perfect data, and you don’t need to know what the problem is before you start. In fact, that’s rather the point.
Enrollment Pulse — $49 → See what changed in your enrollment →
About the author

Hanna-Mari Kirs
Founder & Strategist, Heroes & Guides
Hanna-Mari is an enrollment strategist researching how online educators, certification providers and course creators can improve student enrollment conversion through clearer enrollment journeys, decision-making psychology and website strategy.